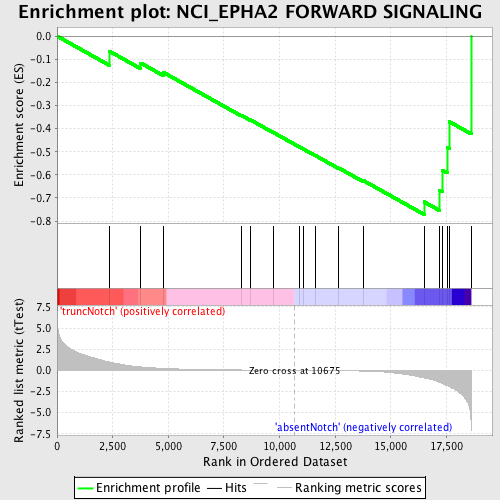
Profile of the Running ES Score & Positions of GeneSet Members on the Rank Ordered List
| Dataset | Set_03_absentNotch_versus_truncNotch.phenotype_absentNotch_versus_truncNotch.cls #truncNotch_versus_absentNotch |
| Phenotype | phenotype_absentNotch_versus_truncNotch.cls#truncNotch_versus_absentNotch |
| Upregulated in class | absentNotch |
| GeneSet | NCI_EPHA2 FORWARD SIGNALING |
| Enrichment Score (ES) | -0.77136844 |
| Normalized Enrichment Score (NES) | -1.5865285 |
| Nominal p-value | 0.00896861 |
| FDR q-value | 0.26528943 |
| FWER p-Value | 0.956 |
| PROBE | DESCRIPTION (from dataset) | GENE SYMBOL | GENE_TITLE | RANK IN GENE LIST | RANK METRIC SCORE | RUNNING ES | CORE ENRICHMENT | |
|---|---|---|---|---|---|---|---|---|
| 1 | RHOA | 580142 5900131 5340450 | 2337 | 1.002 | -0.0645 | No | ||
| 2 | EPHA2 | 5890056 | 3762 | 0.403 | -0.1165 | No | ||
| 3 | BCAR1 | 1340215 | 4773 | 0.233 | -0.1566 | No | ||
| 4 | ACP1 | 1990435 | 8272 | 0.044 | -0.3420 | No | ||
| 5 | PIK3R1 | 4730671 | 8679 | 0.035 | -0.3617 | No | ||
| 6 | VAV2 | 3610725 5890717 | 9718 | 0.016 | -0.4166 | No | ||
| 7 | SRC | 580132 | 10879 | -0.003 | -0.4787 | No | ||
| 8 | EFNA1 | 3840672 | 11083 | -0.007 | -0.4892 | No | ||
| 9 | VAV3 | 1050731 2450242 2680653 | 11608 | -0.016 | -0.5164 | No | ||
| 10 | PIK3CA | 6220129 | 12656 | -0.041 | -0.5702 | No | ||
| 11 | PAK1 | 4540315 | 13762 | -0.085 | -0.6244 | No | ||
| 12 | INPPL1 | 110717 3120164 | 16497 | -0.893 | -0.7169 | Yes | ||
| 13 | TIAM1 | 5420288 | 17196 | -1.424 | -0.6676 | Yes | ||
| 14 | RAC1 | 4810687 | 17312 | -1.548 | -0.5794 | Yes | ||
| 15 | CBL | 6380068 | 17537 | -1.799 | -0.4817 | Yes | ||
| 16 | GRB2 | 6650398 | 17634 | -1.909 | -0.3704 | Yes | ||
| 17 | PTK2 | 1780148 | 18615 | -6.937 | 0.0001 | Yes |

